


Key factors affecting fuel consumption during different flight phases, as identified from QAR data, are chosen as inputs for the model. The dataset comprises 44 flights, each containing approximately 12,000 trajectory points.
The RBF Neural Network is then employed for fuel consumption prediction and analysis. The parameters involved in the experiment include the radial basis function width (δ) and the number of hidden layer neurons (n).
Influence of radial basis function width
In an RBF network, the selection of δ is a critical factor influencing the prediction performance. A larger δ results in a smoother fitting curve for the model, reducing its complexity. However, this can lead to underfitting, where the model fails to capture detailed features in the data. Conversely, a smaller δ makes the model more complex, enabling it to fit the training data more precisely, but it may lead to overfitting. By fixing the number of hidden layer neurons and selecting different values for δ, the error rate of the prediction is computed, as shown in Table 4. The results indicate that when δ is set to 0.34, the prediction error rate is minimized across all flight phases. The experiment demonstrates that an appropriately chosen δ can achieve a good balance between fitting ability and generalization capability, thereby reducing prediction errors and enhancing prediction accuracy. Consequently, in this study, a radial basis function width of 0.34 is selected for the prediction analysis.
Influence of the number of hidden layer neurons
The number of n has a significant impact on the model’s fitting performance. Increasing the number of neurons typically enhances the model’s ability to capture more data features, improving its fitting capacity. However, an excessive number of neurons may lead to an overly complex model, causing overfitting. In contrast, fewer neurons help prevent overfitting but may result in an insufficiently complex model, leading to underfitting. By fixing the radial basis function width and selecting different n, various prediction results are obtained, as shown in Table 5. The experimental results demonstrate that an appropriately chosen number of hidden neurons strikes a balance between the model’s fitting ability and generalization capacity, leading to better prediction performance. It can be observed from Table 5 that when n is set to 4000 for the takeoff/climb and cruise phases, and n is set to 2000 for the descent/approach phase, the prediction error rate reaches its minimum. Therefore, for the takeoff/climb and cruise phases, 4000 hidden layer neurons are selected, while for the descent/approach phase, 2000 hidden layer neurons are chosen for the prediction analysis.
Comparative analysis
The key factors influencing fuel consumption in different flight phases from the QAR data are separately input into the RBF Neural Network fuel consumption prediction model. The predicted results are obtained, and compared with the results from the Convolutional Neural Network (CNN) models24and Multi-Layer Perceptron (MLP) models25. All three models were trained and tested on the same dataset to ensure consistency and fairness in comparison. The CNN model consists of two convolutional layers, one pooling layer, and an output layer, as shown in Fig. 6a. The MLP model comprises a single hidden layer with three hidden neurons, as illustrated in Fig. 6(b). The prediction error rates are shown in Fig. 7.

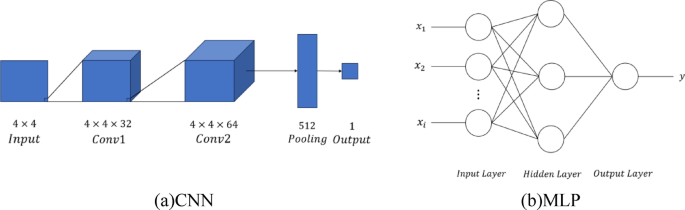
Structure of CNN and MLP.
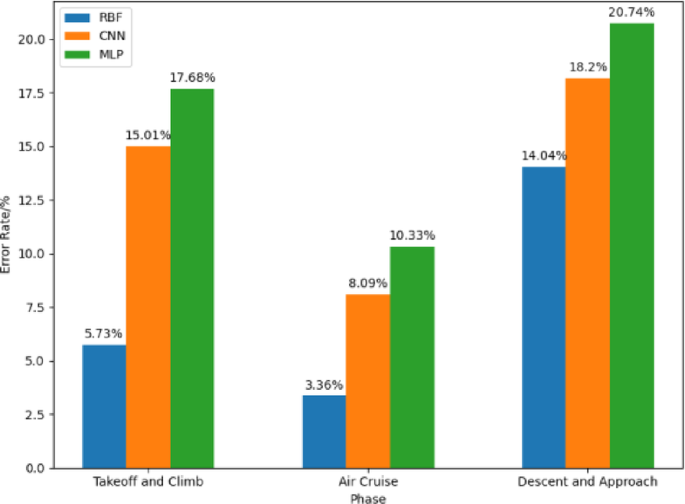
Comparison of error rate.
From Fig. 7, it can be observed that in the takeoff and climb phase, the average error rate of the RBF Neural Network model is 5.73%, which is lower than the CNN model’s 15.01% and the MLP model’s 17.68%.
The predicted results are shown in Fig. 8. It can be seen that the RBF Neural Network model can effectively predict the fuel consumption of the aircraft during the climb phase, and it is relatively close to the actual values. However, there are occasional fluctuations in the predictions.
Prediction results of the FF in take-off and climb phase.
During the cruise phase, the RBF Neural Network model has an average error rate of 3.36%, which is lower than the CNN model’s 8.09% and the MLP model’s 10.33%.
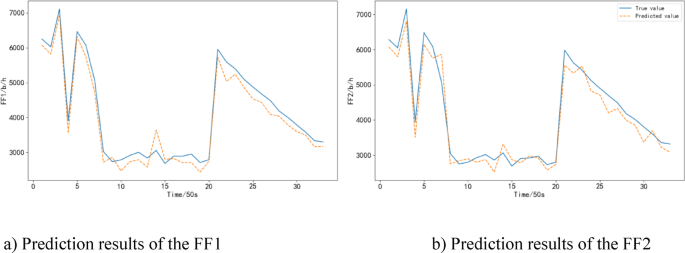
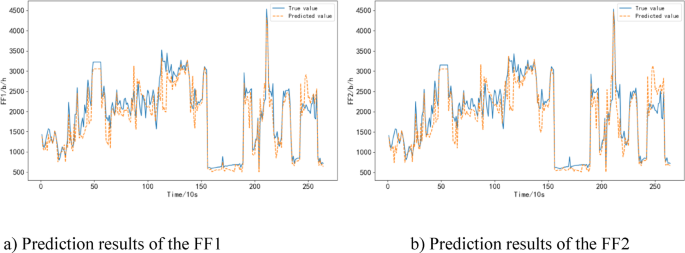
The predicted results are shown in Fig. 9. It can be seen that the RBF Neural Network model more accurately predicts the fuel consumption of the aircraft during the cruise phase. It is worth noting that fuel consumption, as a variable influenced by multiple flight conditions and external environmental factors, inherently exhibits significant volatility. This volatility can also be reflected in the model’s prediction results, potentially leading to a certain degree of instability in the predicted fuel consumption curves.
Prediction results of the FF in cruise phase.
During the descent/approach phase, the RBF Neural Network model has an average error rate of 14.04%, which is lower than the CNN model’s 18.20% and the MLP model’s 20.74%.
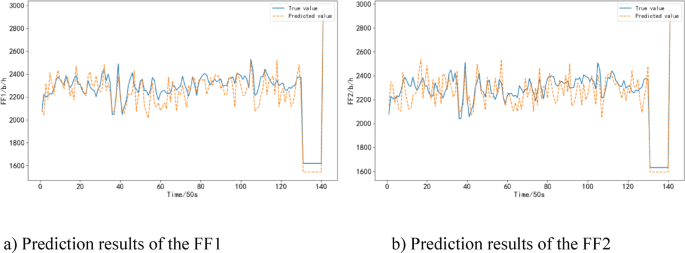
The predicted results are shown in Fig. 10. It can be observed that the RBF Neural Network model exhibits larger prediction errors during the descent/approach phase compared to the cruise phase. However, it still outperforms the other models in terms of accuracy.
Prediction results of the FF in the descent/approach phase.
This is because during the cruise phase, the aircraft is in a relatively stable flight state with fewer maneuvering actions. Moreover, the cruise phase constitutes a significant proportion of the entire flight duration. Therefore, the overall prediction error rate is lower during the cruise phase. Among the models, the RBF Neural Network model exhibits the smallest prediction error.
On the other hand, during the descent/approach phase, the aircraft is under the control of air traffic controllers, leading to more maneuvering actions and frequent changes in flight conditions. Additionally, this phase is relatively short in duration. As a result, the descent/approach phase generally exhibits higher prediction error rates. However, even in this phase, the RBF Neural Network model has the smallest prediction error among the three models, indicating that the RBF Neural Network model outperforms the other two models in terms of predictive performance.
In summary, the comparison with CNN and MLP models reveals that the RBF Neural Network consistently achieves lower prediction errors across all three flight phases, with its advantages particularly pronounced during the takeoff/climb and cruise phases. This indicates that the RBF model has stronger modeling and generalization capabilities when handling flight phases characterized by significant nonlinear features and relatively stable states. Although the prediction error in the descent/approach phase is relatively higher, the RBF model still outperforms the other models, reflecting its adaptability to complex and dynamic flight conditions. Overall, the results validate the effectiveness and superiority of the RBF network in aircraft fuel consumption prediction.
Analysis of influencing factor set validation
Based on the availability of data, the influencing factors have been divided into three parameter sets: Few Parameters Set, Moderate Parameters Set, and Many Parameters Set. The Five influencing factors in the Few Parameters Set can be obtained from ADS-B data, making it an easily accessible dataset. ADS-B is an automated broadcasting technology for use in aviation that provides real-time precise position information and environmental awareness. The Eight influencing factors in the Moderate Parameters Set can be obtained from both ADS-B data and meteorological data, making it a relatively easy dataset to obtain. The Many Parameters Set includes some influencing factors that can only be obtained from QAR data, making it a less accessible dataset.
Based on the types of parameters and the difficulty in obtaining them, the set of influencing factors has been redefined, as shown in Table 6.
These three parameter sets are separately input into the RBF Neural Network fuel consumption prediction models for each flight phase. The predicted results are compared with those obtained from CNN and MLP models, and the prediction errors are shown in Table 7.
From Table 7, it can be observed that when using the set of few parameters as input, all three models exhibit relatively large prediction error rates. As the number of parameters increases, the prediction errors for all models gradually decrease. Among them, the RBF Neural Network fuel consumption prediction model shows the smallest prediction error, indicating superior prediction performance compared to the other two models.
In terms of flight phases, the descent/approach phase involves more maneuvering actions and frequent changes in flight status, which results in relatively higher overall prediction error rates. On the other hand, the cruise phase exhibits more stable flight conditions with fewer maneuvering actions, and it also constitutes a larger proportion of the overall flight duration. Therefore, the prediction error rates for the cruise phase are generally lower. Across the three different flight phases, the RBF Neural Network fuel consumption model consistently demonstrates the smallest prediction errors among the three models, indicating its superior prediction performance and stronger robustness.
In conclusion, the more input parameters the model has, the smaller the prediction errors, which further validates the robustness of the RBF Neural Network model. Comparing it to the set of key factors selected through various methods, the redefined sets of influencing factors based on the type of parameters and the ease of their acquisition exhibit deviations in the prediction performance after being input into the model. This highlights the importance of conducting an analysis of influencing factors.
Ten-fold cross validation analysis
In order to verify the robustness of the RBF Neural Network-based fuel consumption prediction model, a cross validation26 approach was employed. Cross validation is a statistical technique that involves dividing the data sample into smaller subsets. In this study, the ten-fold cross validation method was chosen. The total dataset was divided into 10 groups, and in each iteration, one subset was randomly selected as the test set, while the remaining nine subsets were combined to form the training set, as shown in Fig. 11.

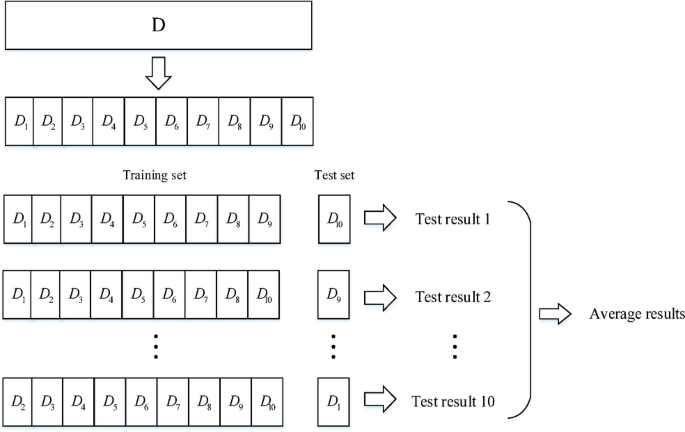
Schematic diagram of ten-fold cross verification.
In this study, a total of 44 flights are used in the QAR dataset. Therefore, for the ten-fold cross validation, the training set consisted of 40 flights, and the test set consisted of 4 flights. The results of the cross validation are presented in Table 8.
From Table 8, it can be observed that the average error rate of the RBF Neural Network-based fuel consumption prediction model during the takeoff/climb phase, as determined through cross validation, is 6.08%. For the cruise phase, the average error rate is 3.68%, and for the descent/approach phase, the average error rate is 14.03%. The variances for all three phases are relatively small, further confirming the robustness of the model. In addition, the cross-validation results show minimal fluctuation in errors across different folds, indicating that the model does not rely on certain specific composition of the training or testing sets. This suggests greater reliability of the model in practical applications.
link